Blog
How To Analyse Data in 2025? A Step-by-Step Guide & Expert Tips For Data Management Professionals!
Data and AI have ushered a new gold rush for Aussie businesses and professionals in 2025 through data analysis. But for someone with no background in data, this seems another difficult task to do. Data analysis is a big word and entails a much bigger question - how to analyse data?
Conquering spreadsheets and data blocks isn’t enough to call it a day.
Thankfully, you've landed at the right blog! Let's unlock data analysis, the art of transforming raw data into actionable knowledge, and learn the step-by-step process of how to analyse data to help your data management process.
What’s Inside?
- Why Data Analysis Is Crucial for Data Management Professionals
- 5 Stages of Data Analysis
- Methods of Data Analysis
- Strategies of Data Analysis
- How To Analyse Data - A Sample Guide
- Embrace Data Analysis With Us!
Why Data Analysis Is Crucial for Data Management Professionals?
Data analysis is crucial for data management professionals as it helps them achieve the following:
Extracting Value
Data management is all about organisation and accessibility, but the true worth of data comes from the insights it holds. Data analysis allows data management professionals to unlock this value by transforming raw data into actionable knowledge.
Informed Decisions
Data management professionals are often the custodians of a company's most valuable asset – its data. By knowing how to analyse data, they can provide informed recommendations and guide decision-making across the organisation.
Improved Data Quality
Data analysis helps data management professionals identify and address inconsistencies and errors within the data. This ensures the data they manage is accurate, reliable, and ultimately, fit for purpose.
Future-Proofing Data Strategies
The data landscape in 2024 is constantly evolving. By being familiar with data analysis techniques, data management professionals can stay ahead of the curve, identify emerging trends, and adapt their data strategies to maximise its value.
In short, data analysis empowers data management professionals to move beyond simply storing data to unlocking its true potential and driving real business value.
5 Stages of Data Analysis
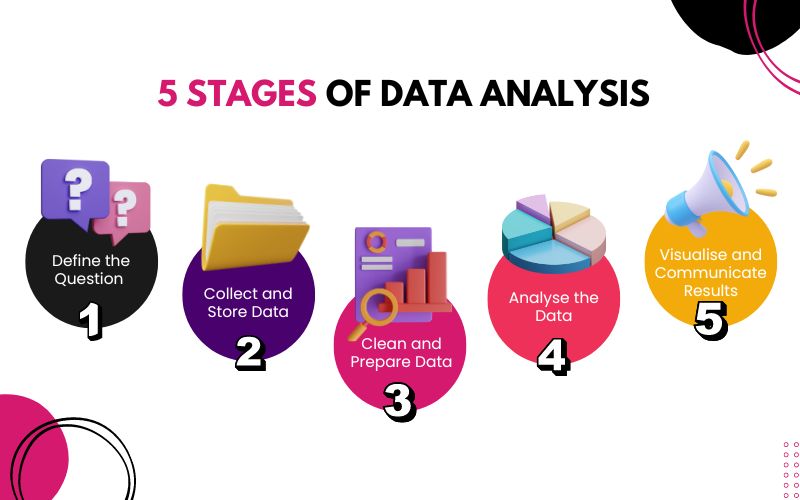
For starters, the question of how to analyse data can be broken down into a cyclical process guiding you from raw data to actionable insights. While the names may vary slightly depending on the source, they are classified commonly into these stages.
Define the Question
Here, you identify the specific business issue you want answered or solved. A clear goal keeps your analysis focused and ensures you're collecting the right data needed for your questions or problems.
Collect and Store Data
Once you know what you'll be answering, gather the necessary data. This might include information from internal databases, customer surveys, social media feeds, or any relevant sources.
Clean and Prepare Data
Raw data is rarely perfect. This stage involves identifying and correcting errors, inconsistencies, and missing values. You might also need to format the data for analysis.
Analyse the Data
This is where you apply statistical methods on how to analyse data, machine learning algorithms, or other techniques to extract insights from the data. The specific tools and techniques will depend on your goal and the type of data you have.
Visualise and Communicate Results
Once you have insights, present them clearly and concisely. Charts, graphs, and other data visualisations help stakeholders understand your findings and make informed decisions.
Methods of Data Analysis
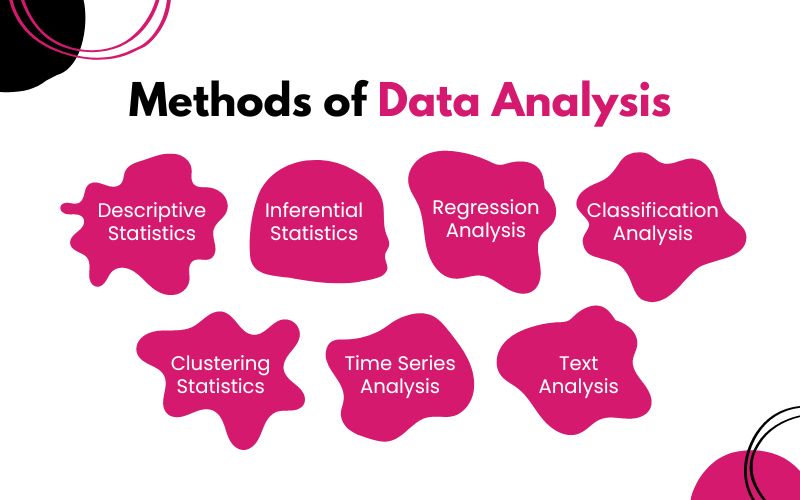
How to analyse data? Data analysis methods are like a toolbox filled with specialised instruments for uncovering hidden gems within your data. The specific method you choose depends on the type of data you have and the kind of insights you're seeking.
Descriptive Statistics
This is your bread and butter, summarising your data using measures like central tendency (average, median) and dispersion (range, standard deviation). It helps you understand the basic characteristics of your data set.
Inferential Statistics
Ever wonder if a pattern you see in your data applies to the bigger picture? Inferential statistics help you conclude a population based on a sample of data. This allows you to make predictions or test hypotheses.
Regression Analysis
This technique explores the relationship between variables. Think of it like finding the cause-and-effect connections within your data. It's useful for modelling and predicting future outcomes.
Classification Analysis
Imagine sorting customers into different groups based on their behaviour. Classification analysis helps you categorise data points based on specific criteria, making it valuable for tasks like customer segmentation and targeted marketing.
Clustering Analysis
This method is like grouping similar data points and uncovering hidden patterns and segments within your data. It helps identify customer groups with similar characteristics or market research for product development.
Time Series Analysis
For data that changes over time, like website traffic or stock prices, time series analysis is your go-to method. It helps you identify trends, seasonality, and forecast future values.
Text Analysis (Natural Language Processing)
In today's data-rich world, text is a goldmine of information. Text analysis techniques let you extract meaning from written content, like customer reviews, social media posts, or surveys. This can be used for sentiment analysis, topic modelling, and understanding customer feedback.
The field of data analysis is constantly evolving. But by understanding these core methods, you'll be well-equipped to tackle how to analyse data.
Strategies of Data Analysis
Data analysis strategies go beyond the individual methods. They and delve into the overall approach you take into transforming data into insights.Analysing your data begins here: Answering how to analyse data begins and continues with these steps.
Data analysis strategies go beyond individual methods. They delve into the overall approach you take in transforming data into insights. Analysing your data begins here.
Start with the Business Problem
Don't get lost in finding out how to analyse data itself. Every data analysis project should begin with a clear understanding of the business problem you're trying to solve or the question you're trying to answer. This focus ensures your analysis is targeted and delivers actionable insights.
Embrace the Agile Mindset
Data is rarely static, and business needs can evolve. Be prepared to adapt your analysis as you uncover new information or trends. Think of data analysis as an iterative process, where you can refine your approach and think deeper based on your findings.
Data Visualisation Matters
A thousand data points can be worth a single compelling chart. Data visualisation tools help you translate complex information into easy-to-understand visuals that resonate with stakeholders.
Data Storytelling
Numbers are important, but they don't tell the whole story. Use your analysis to craft a narrative that connects the data to your business goals. Explain what the data means, why it's important, and how it can be used to make informed decisions.
Collaboration is Key
Finding out how to analyse data is rarely a one-person show. Collaborate with data scientists, business analysts, and domain experts to ensure your analysis considers different perspectives and leads to actionable outcomes.
Invest in the Right Tools
The right data analysis tools can make all the difference. From powerful BI platforms to user-friendly data-wrangling software, explore the options available and choose tools that fit your specific needs and skillset.
Embrace Continuous Learning
The data landscape is ever-changing, with new tools, techniques, and best practices emerging all the time. Commit to continuous learning to stay ahead of the curve and get the most out of your data analysis efforts.
The question of how to analyse data becomes easier to tackle by incorporating these data analysis strategies.
How to Analyse Data - A Sample Guide
Asking how to do data analysis is more interesting now as it's your turn to do it. From the previous data analysis strategies and stages, treating data as a friend is more crucial than ever.
If all these steps need more elaboration, here's an example of how to effectively apply data analysis strategies for your business.
Say Emily, a data management professional, works for a subscription-based fitness app. Retention is a key metric for the app's success, so Emily is tasked with analysing customer churn to identify trends and develop strategies to keep users engaged.
Here's the process she must follow for a successful data analysis
Step 1: Define the Question
Emily's goal is to understand why customers are cancelling their subscriptions. She wants to identify common factors and develop targeted strategies to reduce churn.
Step 2: Collect and Store Data
Emily gathers data from various sources:
- Subscription data: This includes signup dates, cancellation dates, and subscription plans.
- User activity data: This tracks how often users log in, what features they use, and the duration of workouts.
- Demographic data: This includes age, location, and gender information, collected with user consent.
Step 3: Clean and Prepare Data
The data might be inconsistent or missing values. Emily cleans the data by:
- Standardising date formats
- Filling in missing values (ex. average usage for inactive users)
- Removing duplicate entries
Step 4: Analyse the Data
She uses a combination of data analysis methods:
- Descriptive Statistics: She calculates the churn rate (percentage of users cancelling each month) and analyses user demographics to see if any groups have higher churn rates.
- Cohort Analysis: She groups users by signup month and tracks their churn rate over time to identify patterns.
- Regression Analysis: She explores the relationship between user activity and churn rate to see if low activity results in cancellation.
Step 5: Visualise and Communicate Results
Emily creates clear and concise visualisations
- Line charts to show churn rate by month
- Bar charts to compare churn rates across different demographics
- Scatter plots to explore the relationship between user activity and churn
Taking Action
Based on her analysis, Emily discovers that inactive users for two or more weeks are more likely to churn. She recommends:
- Targeted communication: Sending re-engagement emails to inactive users with motivational messages and workout tips.
- Free trial offers: Providing a free trial for premium features to entice users to explore more of the app.
- Personalised recommendations: Recommending workouts and challenges based on user preferences to keep them engaged.
Data analysis done properly has worked well with Emily. Now, it’s your turn.
Embrace Data Analysis With Us!
Answering how to analyse data is an iterative process. As you go deeper, you might discover new questions or trends. Be prepared to pivot your approach and explore unexpected avenues. The key is to be adaptable and embrace the journey of discovery.
Does data analysis overwhelm you?
At Elephant in the Boardroom, we can help you navigate the complexities of data analysis. We offer a range of services, from data strategy and architecture to implementation and training.
Let's face it, data analysis is powerful, but it can be tricky to get right. So, why not chat with the experts? Contact us today and let's turn your data into a goldmine of insights!
Search Blogs
Recent Post
-
![]() Tips for Business Owners: How to Make…
Tips for Business Owners: How to Make…Posted on
-
Big Ambitions, Small Budget: How a…
Posted on
-
![]() How to Prepare Your Business for Q4…
How to Prepare Your Business for Q4…Posted on


